Display the criteria associated with a collection of PLNmixture fits (a PLNmixturefamily)
Source:R/PLNmixturefamily-S3methods.R
plot.PLNmixturefamily.RdDisplay the criteria associated with a collection of PLNmixture fits (a PLNmixturefamily)
Arguments
- x
an R6 object with class
PLNmixturefamily- type
a character, either
"criteria"or"diagnostic"for the type of plot.- criteria
vector of characters. The criteria to plot in c("loglik", "BIC", "ICL"). Default is c("loglik", "BIC", "ICL").
- reverse
A logical indicating whether to plot the value of the criteria in the "natural" direction (loglik - 0.5 penalty) or in the "reverse" direction (-2 loglik + penalty). Default to FALSE, i.e use the natural direction, on the same scale as the log-likelihood.
- ...
additional parameters for S3 compatibility. Not used
Value
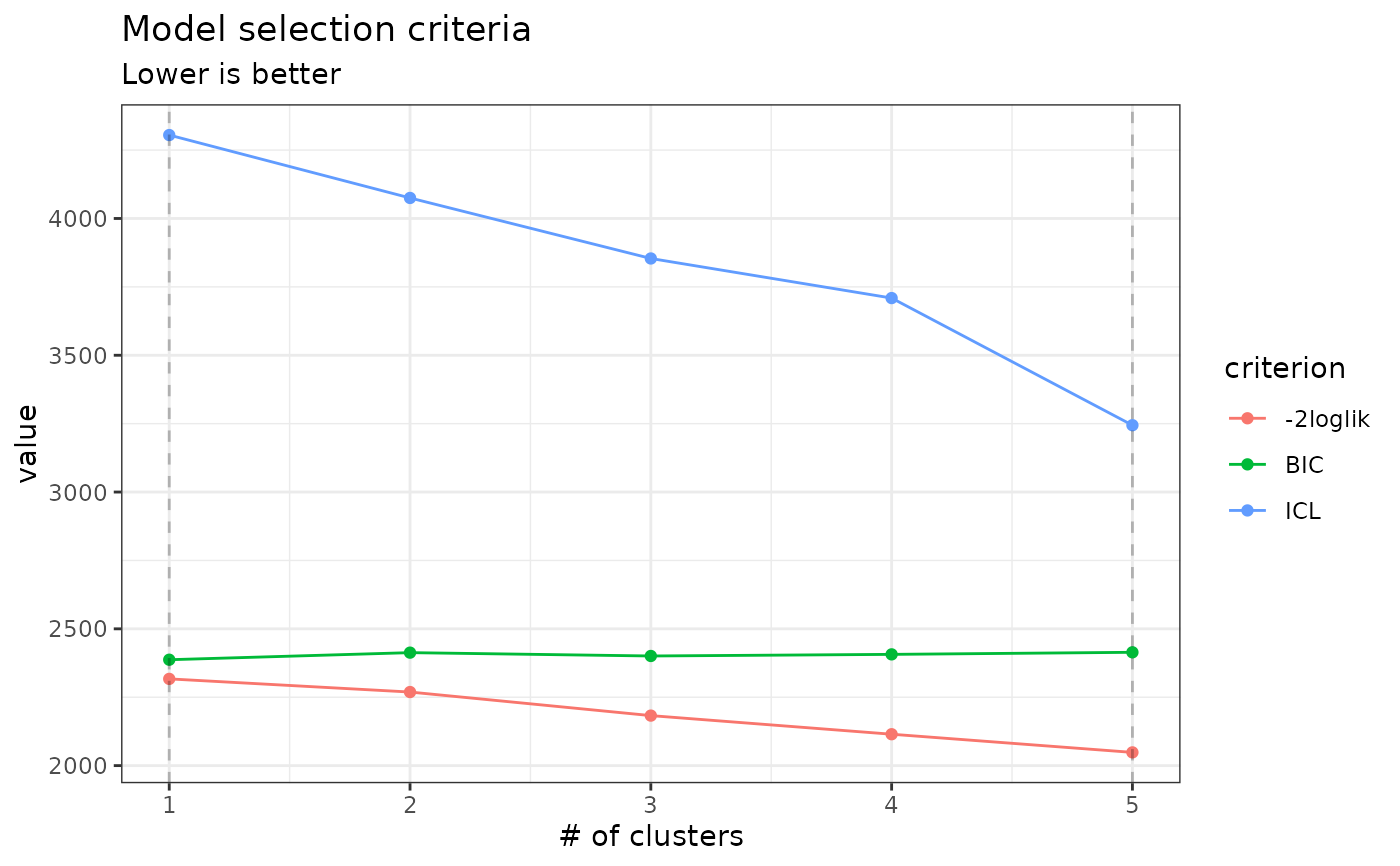
Produces either a diagnostic plot (with type = 'diagnostic') or the evolution of the criteria
of the different models considered (with type = 'criteria', the default).
Details
The BIC and ICL criteria have the form 'loglik - 1/2 * penalty'
so that they are on the same scale as the model log-likelihood. You can change this direction and use the alternate form '-2*loglik + penalty', as some authors do, by setting reverse = TRUE.
Examples
data(trichoptera)
trichoptera <- prepare_data(trichoptera$Abundance, trichoptera$Covariate)
myMixtures <- PLNmixture(Abundance ~ 1 + offset(log(Offset)),
           data = trichoptera, control = PLNmixture_param(smoothing = "none"))
#>
#>  Initialization...
#>
#>  Adjusting 5 PLN mixture models.
#> 	number of cluster = 1
	number of cluster = 2
	number of cluster = 3
	number of cluster = 4
	number of cluster = 5

#>  Post-treatments
#>  DONE!
plot(myMixtures, reverse = TRUE)